Effect of competition on the distribution of Marram Grass within a sand dune system
Introduction
Sand dunes provide a classic example of the progression of ecological succession, with species becoming more varied and numerous as time passes. As one species makes the conditions less harsh, another is able to grow and thrive, eventually out-competing the first species.
Sand dunes begin to form when sand is blown inshore from a beach. The sand is trapped by obstacles such as pebbles, seaweed or semi-halophytic plant species such as sea rocket and prickly saltwort on the strand line. These pioneer species have physiological adaptations such as thick waxy leaves and a small surface area which allow them to tolerate salty conditions to some extent, but are not able to tolerate immersion in salt water for long periods of time. The mound of sand begins to grow, as sand deposited on the inshore side of the dune is shielded from the wind by the mound itself.
As the mound of sand grows, marram grass seeds are deposited. The marram grass can survive the extreme hot and dry conditions to which it is exposed due to adaptations such as thick, waxy cuticles on the leaves and an extensive root system. It is the roots of the marram grass which cause the formation of an embryo dune, as then hold the mound of sand together. As the marram grass grows, more sand is trapped and so the dune grows. The bare sand on the dune can still be blown by the wind, however, and so the dune is said to be mobile.
On mobile dunes, the most prevalent plant is still marram grass, though in particularly sheltered areas plant species such as sea spurge, which is adapted to dry conditions, can occasionally be found. Mobile dunes are found further inland than embryo dunes.
Moving yet further in land, semi-fixed dunes can be found. These are dunes that are less mobile than mobile dunes, and yet more mobile than fixed dunes. It is on these dunes that the variety of species becomes larger, as there is shelter from the wind and salt spray, and the dunes are no longer growing as fast. Mosses, lichens and colourful plants such as ragwort and restharrow are prevalent in on mobile dunes. Bacteria in the root nodules of several of these plants are able to fix nitrogen, which adds to the organic matter found in the soil.
Fixed dunes, found still further inland, are completely covered in vegetation. Little marram grass is found on fixed dunes, but grasses such as red fescue and spreading meadowgrass are common.
Sometimes, flat hollows form in fixed dunes. These are created by continual erosion of the sand. One the hollow has reached the level of the water table, the sand can be eroded no more since the wind cannot blow wet sand. These areas have improved plant growth, since rabbits extensively graze the area and fertilise it with their droppings.
The climax stage in dune succession is scrubland and forest.
Throughout succession, the number of animal species present increases at each stage, from virtually no animals being present on embryo dunes to a high diversity and abundance of life on fixed dunes. Also, a number of abiotic factors change with succession: for example, the pH becomes more acidic through the various stages in succession, as the concentration of alkaline crushed shells in the sand decreases. These abiotic factors determine which species can grow.
This investigation aims to examine the plant species found in a sand dune system, concentrating particularly on marram grass, which plays an essential part in the early formation of the dunes, and yet is barely present in the final stages of succession. Why is it that such an essential species in terms of initial formation of the dunes should be found so sparsely distributed when the climax community has been reached?
Null Hypothesis
The null hypothesis for this investigation is that there is no difference in the distribution of marram grass within the sand dune system. The plant species will be distributed similarly throughout the dunes, and so competition will not affect the distribution of the Marram grass.
Method
Due to the constraints of time, only two sites could be adequately sampled. Therefore, an area of 15m x 15m was chosen on each of two dune areas, and marked out using tape measures. In order to obtain the best idea of how dunes change over time, the areas chosen were in distinctly different stages of succession: Mobile dunes, in the fairly early stages, and fixed dunes, in the much later stages.
At each site ten samples were taken, the location of which were randomly chosen using a random numbers table: The first figure below or equal to 15 in the first column was located, and provided the x coordinate for first random sample. The second number below or equal to 15 provided the y coordinate. For example, if the first two suitable numbers were 5 and 11, a sample would have been taken at the point 5m across, 11m down. The coordinates for each sample were selected following the same principle with the next suitable numbers, working up the second column and down the third. The percentage cover of each plant species was then estimated using the grid quadrat for each sample. The cover was estimated using the formula
Percentage cover = (Number of sqaures on grid quadrat a particular species covers / the total number of squares) x 100
Plant species were identified through the use of various plant identification books which were provided. It was decided that ten samples would be enough to avoid bias towards one particular part of each location and also to identify anomalous results – clearly, more samples may have been useful for this, but time did not allow for these to be taken.
At the location of the first random sample at each site, an optimum quadrat size study was undertaken. This was necessary to ensure that the number of species found within each sample was likely to be representative of the site as a whole. To do this, square quadrats of side 10cm, 20cm, 30cm, 50cm and 1m were laid down and the number of species within each was counted. The study was then repeated in order to reduce the effect of anomalous results on the final graph. The optimum quadrat size was then determined by drawing a graph of the mean values, as shown in ‘Results’. The first quadrat at the point where the graph levels off is known as the ‘optimum quadrat’, and is the size that should have been used for all of the sampling at a particular site.
At both of the sites, measurements of four abiotic factors were taken: soil pH, soil temperature, air temperature and water infiltration rate. These were taken so that their effects can be taken into consideration when analysing the results. Water infiltration rate was measured by timing how long it took 100cm3 of water to soak from an infiltration tube into the soil at each site. Soil temperature and air temperature were measured using an alcohol thermometer (as these are less hazardous than the mercury variety), and pH was measured using a universal indicator soil testing kit. The investigation itself was conducted over one day only. In this way, changed in conditions such as heavy rainfall which may have seriously affected the outcome of the abiotic factor tests were minimised.
Results
In the following table, mean percentages have been calculated using the formula
Mean = (total of percentages in each quadrat / total number of quadrats)
The mean has been calculated so that all of the data from one location can easily be compared with all of the data from the second location, and so that the effect of anomalous results on overall results is minimised.
For optimum quadrat size determination, the following formula has been used to find the mean value:
Mean = (number of species on 1st attempt + number of species on 2nd attempt) / 2
As Marram Grass is the subject of this investigation, its row has been highlighted throughout. ‘Q’ is used to indicate ‘Quadrat’.
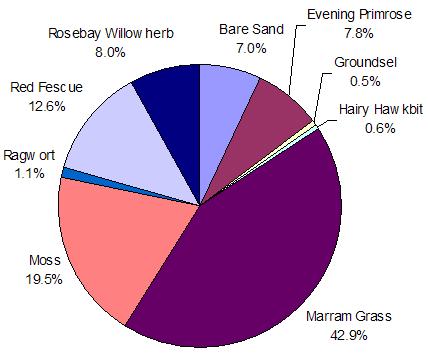
Location A
|
Species |
Percentage Cover at Location A (Mobile Dune) |
Mean |
|||||||||
| Q1 |
Q2 |
Q3 |
Q4 |
Q5 |
Q6 |
Q7 |
Q8 |
Q9 |
Q10 |
||
| Bare Sand |
0 |
0 |
40 |
5 |
0 |
5 |
20 |
0 |
0 |
0 |
7.0 |
| Evening Primrose |
0 |
0 |
0 |
0 |
48 |
0 |
30 |
0 |
0 |
0 |
7.8 |
| Groundsel |
0 |
5 |
0 |
0 |
0 |
0 |
0 |
0 |
0 |
0 |
0.5 |
| Hairy Hawkbit |
0 |
5 |
0 |
0 |
1 |
0 |
0 |
0 |
0 |
0 |
0.6 |
| Marram Grass |
50 |
60 |
25 |
50 |
49 |
55 |
10 |
50 |
40 |
40 |
42.9 |
| Moss |
0 |
0 |
5 |
40 |
0 |
0 |
40 |
30 |
30 |
50 |
19.5 |
| Ragwort |
5 |
0 |
5 |
0 |
1 |
0 |
0 |
0 |
0 |
0 |
1.1 |
| Red Fescue |
5 |
30 |
25 |
0 |
0 |
40 |
0 |
5 |
20 |
1 |
12.6 |
| Rosebay Willowherb |
40 |
0 |
0 |
5 |
1 |
0 |
0 |
15 |
10 |
9 |
8.0 |
Total number of species identified: 8
The mean data for this location can be graphically represented in a pie chart:
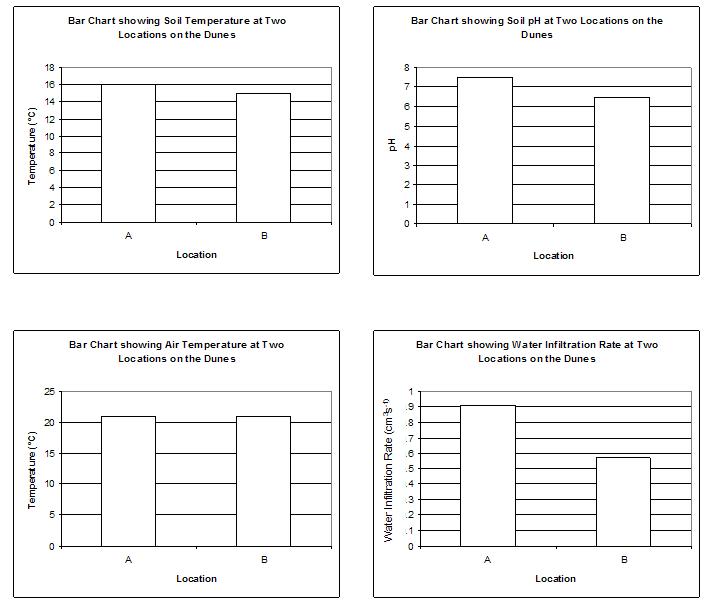
| Table of Abiotic Factor data for Location A |
|
| pH |
7.5 |
| Soil temperature |
16°C |
| Air temperature |
21°C |
| Water infiltration rate |
0.91cm3s-1 |
At location A, the optimum quadrat size study produced the following results:
|
Size of quadrat |
Number of Species within Quadrat |
Mean Number of Species |
|
| 1st reading |
2nd reading |
||
| 10cm x 10cm |
2 |
3 |
2.5 |
| 20cm x 20cm |
4 |
3 |
3.5 |
| 30cm x 30cm |
4 |
4 |
4.0 |
| 50cm x 50cm |
6 |
6 |
6.0 |
| 100cm x 100cm |
7 |
7 |
7.0 |
These data can be shown on a graph as shown on the following page. It is clear that the optimum quadrat size for this particular location had not been reached by a 100cm x 100cm quadrat. However, due to the constraints of the equipment provided during the investigation, a 50cm x 50cm quadrat was used for sampling at Location A.
[Graph originally appeared here]
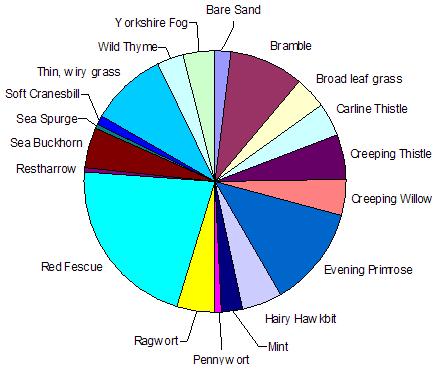
Location B
|
Species |
Percentage Cover at Location B (Fixed Dune) |
Mean |
|||||||||
| Q11 |
Q12 |
Q13 |
Q14 |
Q15 |
Q16 |
Q17 |
Q18 |
Q19 |
Q20 |
||
| Bare Sand |
0 |
0 |
0 |
20 |
0 |
0 |
0 |
0 |
0 |
0 |
2.0 |
| Bramble |
40 |
10 |
0 |
30 |
10 |
0 |
0 |
0 |
0 |
0 |
9.0 |
| Broad leaf grass |
5 |
25 |
10 |
0 |
0 |
0 |
0 |
0 |
0 |
0 |
4.0 |
| Carline Thistle |
5 |
5 |
0 |
0 |
0 |
5 |
10 |
0 |
0 |
16 |
4.1 |
| Creeping Thistle |
0 |
0 |
0 |
0 |
15 |
0 |
0 |
20 |
20 |
0 |
5.5 |
| Creeping Willow |
10 |
0 |
0 |
0 |
0 |
25 |
0 |
10 |
0 |
0 |
4.5 |
| Evening Primrose |
0 |
0 |
0 |
20 |
0 |
0 |
50 |
15 |
40 |
0 |
12.5 |
| Hairy Hawkbit |
0 |
0 |
50 |
0 |
0 |
0 |
0 |
0 |
0 |
0 |
5.0 |
| Marram Grass |
0 |
0 |
0 |
0 |
0 |
0 |
0 |
0 |
0 |
0 |
0.0 |
| Mint |
0 |
0 |
5 |
0 |
10 |
0 |
10 |
0 |
0 |
0 |
2.5 |
| Pennywort |
5 |
0 |
5 |
0 |
0 |
0 |
0 |
0 |
0 |
0 |
1.0 |
| Ragwort |
0 |
15 |
0 |
0 |
25 |
0 |
0 |
0 |
5 |
0 |
4.5 |
| Red Fescue |
30 |
0 |
0 |
0 |
25 |
20 |
25 |
45 |
30 |
40 |
21.5 |
| Restharrow |
0 |
5 |
0 |
0 |
0 |
0 |
0 |
0 |
0 |
0 |
0.5 |
| Sea Buckhorn |
0 |
0 |
0 |
0 |
0 |
50 |
0 |
0 |
0 |
0 |
5.0 |
| Sea Spurge |
0 |
0 |
0 |
0 |
0 |
0 |
5 |
0 |
0 |
0 |
0.5 |
| Soft Cranesbill |
0 |
0 |
0 |
0 |
0 |
0 |
0 |
0 |
0 |
12 |
1.2 |
| Thin, wiry grass |
5 |
30 |
30 |
30 |
0 |
0 |
0 |
0 |
0 |
0 |
9.5 |
| Wild Thyme |
0 |
0 |
0 |
0 |
0 |
0 |
0 |
0 |
0 |
32 |
3.2 |
| Yorkshire Fog |
0 |
10 |
0 |
0 |
15 |
0 |
0 |
10 |
5 |
0 |
4.0 |
Total number of species identified: 18
The data for this location can also be represented in a pie chart:
| Table of Abiotic Factor data for Location B |
|
| pH |
6.5 |
| Soil temperature |
15°C |
| Air temperature |
21°C |
| Water infiltration rate |
0.57cm3s-1 |
The abiotic factor data for both sites can be represented on a series of comparative bar charts.
At Location B, the optimum quadrat size study produced the following results:
|
Size of quadrat |
Number of Species within Quadrat |
Mean Number of Species |
|
| 1st reading |
2nd reading |
||
| 10cm x 10cm |
3 |
3 |
3.0 |
| 20cm x 20cm |
4 |
4 |
4.0 |
| 30cm x 30cm |
6 |
6 |
6.0 |
| 50cm x 50cm |
9 |
8 |
8.5 |
| 100cm x 100cm |
9 |
8 |
8.5 |
These data can be shown on a graph as shown on page eight. It is clear that the optimum quadrat size for this particular location is 50cm x 50cm, and so this quadrat was used to sample at Location B.
The mean percentage cover for each species identified at each site can also be plotted on a comparative bar chart, as shown on page nine, and the simple bar chart on page ten shows the large difference in the number of species at the two locations.
From the graphs, particularly the ‘Number of species’ bar chart on page ten, it is clear that there is a large difference in the number of species to be found at each location. However, in order to use a scientific measure of whether this difference is significant, a χ2 test must be applied:
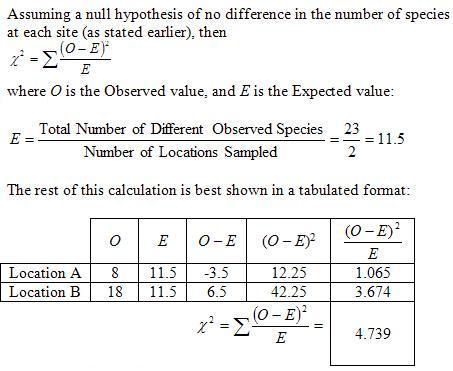
Taking a significance level of 0.05 (5%), and one degree of freedom, Critical value = 3.841
4.739 > 3.841, therefore the result is significant at the 5% level and the null hypothesis is rejected.
Conclusions
From the χ2, it can be concluded that there is a significant difference in the number of species found on the mobile dunes compared to those found on the fixed dunes. The graphs, particularly the “Comparison of Mean Percentage Cover of Species at each Location” graph on page nine, add weight to this result, as it is clear that the majority of the species are unique to one particular site. Therefore, not only are more species found, but, on the whole, it is different species which are found at each site.
Within this investigation, it is clearly important to note the difference in the distribution of Marram Grass at each site. Whilst there was an average 42.9% cover of Marram on the mobile dune, there was no Marram on the fixed dune. The main reason for this is succession on the sand dunes. As pioneer species such as Marram grass grow, they change the conditions, making them less harsh, meaning that more species can grow. As this happens, the new species out-compete the pioneers eventually leading, as has been seen during this investigation, to a complete lack of the pioneers during the later stages of succession.
Marram grass is adapted in a number of ways to survive the conditions found on embryo and mobile dunes. Marram grass can survive the extreme hot and dry conditions to which it is exposed on these early dunes due to adaptations such as thick, waxy cuticles on the leaves which reduce water loss through evaporation and an extensive root system which allows water to be taken in from a large area. Indeed, the extensive root system is the reason for dunes becoming more stable and growing further: the roots are able to hold the sand together in a mound. As more sand is added, the Marram grows up through the sand, further extending its root system and so holding the new sand in place. This constant covering of sand is essential to the survival of Marram grass, as this particular species requires covering in sand regularly in order to grow. Marram grass is also adapted to thrive in conditions which are slightly alkaline, as the small particles of crushed shells which are found in the sand on mobile dunes make the sand slightly alkaline.
In the early stages of succession, there are very few species which can compete with Marram due to the harsh conditions. Few other species can manage to obtain the water and nutrients required to survive, and so Marram is very much the dominant species on the early dunes.
Over time, the Marram grass gradually makes the conditions on the dune less harsh. For example, as some Marram dies off then humus is added to the soil, which creates conditions which other species can withstand. As these plants die, so more humus is added, making it easier for yet more species to grow. Eventually, the conditions are changed from those in which Marram grass thrives, and this causes Marram grass to die off completely. For example, addition of humus to the soil makes it slightly more acidic, as seen during this investigation, and the addition of further root systems causes the soil to retain water more effectively, which means that other species are able to thrive. Also, addition of root systems means that the soil is more firmly held in place, and is not moved as easily by the wind. Thus, the plant species on the dunes are not covered by sand as often, and so Marram grass cannot survive. Many plant species on the fixed dunes have root nodules which contain bacteria which can fix nitrogen, meaning that there are plenty of nitrates in this soil which plant species require in order to survive.
By the time succession has reached the stage studied at Location B, that is, fixed dunes, the Marram grass is unable to survive, as a great variety of other species of plants can thrive in these conditions. This is shown by the lack of any one major dominant species, such as Marram grass at Location A. Whilst there is much Red Fescue on the fixed dune studied, the percentage cover of this species (21.5%) is little over half the percentage cover of Marram on the mobile dune (42.9%), and so Red Fescue is not nearly as dominant as Marram. The very number of species on the fixed dune (18) is significantly more than the number on the mobile dune (8), and this demonstrates how much more hospitable the conditions are to the majority of plant species. It is also noticeable that very few of the species which survived on the early dunes were still able to survive on the later dunes – that is, very few species were found on both the mobile and fixed dunes, due to the complete change in conditions.
As well as the effects of plant species creating more favourable conditions, as the number of species increases significantly, animal species such as rabbits begin to inhabit the fixed dunes, and so add further nutrients and humus to the soil through their droppings.
At these later stages of succession, the conditions have been changed so much from those in which Marram grass thrives that it simply cannot grow at all, causing the complete lack of Marram which was observed on the fixed dune in this investigation. Thus, the role of Marram grass is transformed during the stages of succession from being the most prevalent and important species on the early dunes, to a species which simply cannot survive on the dunes which have reached later stages of succession. This change was clearly seen when examining mobile and fixed dunes during this investigation.
Evaluation
The main limitation of the apparatus used in this investigation occurred at Location A, as the optimum quadrat size could not be determined and could not have been used anyway due to a lack of available apparatus. This may, perhaps, have affected the reliability of the results at Location A, though as similar species were found in each of ten quadrats, it appears that it has had little impact. If completely different species had been found in each quadrat, then this would clearly have suggested that the results were unreliable.
Due to the constraints of time on the investigation, only two sites could be studied, and therefore the full length of ecological succession could not be appreciably studied, as each stage could not be investigated. However, by selecting sites towards the beginning and towards the end of succession, a general overview could be surmised, if not thoroughly investigated. This may affect the reliability of the conclusions that have been drawn from the results, as some of the assumptions that have been made about the various stages of succession are impossible to prove with the data from this investigation, simply because they could not be thoroughly investigated without further sampling locations.
Furthermore, the use of percentage cover to judge the amount of a particular species which was present at a particular site is unreliable. For example, on the mobile dune at Location A, there was much more moss present than is reflected in the results, due to the fact that it was covered by other species. Therefore, the use of percentage cover as an estimate for the prevalence of a particular species is likely to be highly inaccurate.
The method of random sampling significantly improved the reliability of the results, since this meant that ten samples could be taken without introducing bias, thus building up an accurate picture of the location being sampled. Taking ten samples, as well as repeating the optimum quadrat study, ensured that the samples taken were in fact representative of the area as a whole, and allows anomalous results to be identified. For example, quadrat three at Location A contained 40% bare sand – this is clearly not representative of the area as a whole, and, by taking nine other readings, this becomes clear. Obviously, this quadrat represented a part of the location being studied, as it was taken from the location. However, by taking further samples and calculating the average, the effect of such results is reduced to the proportional effect for a small area of the location as a whole.
In order to make significant improvements to this investigation, more sample sites should have been chosen, perhaps one representing every few years of succession, and a better method of calculating the abundance of a particular species should have been used, perhaps by taking the dry mass of each species falling within each quadrat.
However, overall the investigation has been a success, since the abundance and distribution on Marram grass on a sand dune system has been investigated, and extensive conclusions have been drawn from the gathered data.