Effect of Enzyme Concentration on rate of Hydrolysis of gelatin by protease enzymes
Introduction
This experiment was conducted in order to investigate the effect of enzyme concentration upon the rate of hydrolysis of gelatin by the protease enzymes contained in pig pancreatin.
Method
Seven test tubes containing 10 cm3 of protease enzymes solutions of these percentage concentrations were set up: 1.00, 0.75, 0.50, 0.25, 0.10, 0.05, 0.01. These solutions were chosen in order to give the largest possible range of concentrations investigated, in order to give the largest possible range of results. The same amount of solution was used in each test tube so that the investigation was standardised.
The solutions provided were buffered, so that any changes in pH which may have been caused by hydrolysis of the gelatin were avoided, since these could affect the rate of reaction of the enzyme by affecting the bonds stabilising their 3o structure. Major changes in pH may even had lead to the protease enzymes becoming denatured. A pH of 7.5 was chosen as this is the pH at which these enzymes work in the body, and it is also very close to the optimum pH for these particular enzymes.
These test tubes were placed in a water bath at 37oC, and allowed to equilibrate. This temperature was chosen as it is close to body temperature, which is the temperature at which the enzyme would normally work, and therefore could be assumed to be close to the enzyme’s optimum temperature. The test tubes were allowed to equilibrate to ensure that the contents of each test tube had reached 37oC by the start of the experiment, and thus ensure that the contents of one test tube did not have more kinetic energy than the contents of another during the experiment, since this could influence the results obtained.
An equally sized strip of photographic film was placed in each test tube. The size of the strip of film was kept constant in order to ensure that the amount of gelatin for the protease enzyme to digest was also kept constant. The amount of time taken for each strip of film to become clear, and therefore for all of the gelatin to have been digested, was measured and recorded.
The experiment was repeated twice, in order to obtain three sets of results, in order to ensure that the results were reliable, and so that any anomalous results could be excluded. A total of three results were obtained as this is an appropriate number on which to base conclusions. A control experiment was also conducted at each temperature, whereby the solution was boiled prior to use in order to denature the enzymes. The control was set up in order to ensure that all digestion of the gelatin was caused by the protease enzymes, and not due to outside environmental factors.
Results
The full data set collected is shown here:
|
% Concentration |
Time Taken (min) |
||
| Experiment |
Repeat A |
Repeat B |
|
| 0.01 |
10.000 |
10.000 |
9.917 |
| 0.05 |
6.000 |
6.000 |
5.917 |
| 0.10 |
3.500 |
3.417 |
3.417 |
| 0.25 |
2.500 |
2.583 |
2.583 |
| 0.50 |
2.083 |
2.083 |
2.083 |
| 0.75 |
1.750 |
1.750 |
1.750 |
| 1.00 |
1.583 |
1.500 |
1.500 |
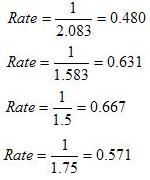
In order to make comparison of the results easier, the rate of the reaction has been calculated using the formula:
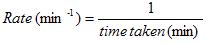
Some examples of this calculation, taken from the data set, are shown below:
Using rate of reaction, the results can now be tabulated like this:
|
% Concentration |
Rate of Reaction (min-1) |
|||
| Experiment |
Repeat A |
Repeat B |
Average |
|
| 0.01 |
0.100 |
0.100 |
0.100 |
0.100 |
| 0.05 |
0.167 |
0.167 |
0.169 |
0.168 |
| 0.10 |
0.286 |
0.293 |
0.293 |
0.291 |
| 0.25 |
0.400 |
0.387 |
0.387 |
0.391 |
| 0.50 |
0.480 |
0.480 |
0.480 |
0.480 |
| 0.75 |
0.571 |
0.571 |
0.571 |
0.571 |
| 1.00 |
0.632 |
0.666 |
0.666 |
0.655 |
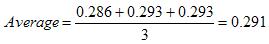
The average results can now be calculated by adding up the three columns and dividing by three. For example:
The average results can then be displayed graphically (and in the original version, said graph appears here, though it’s hand-drawn and I can’t get it online!)
Conclusions
From the results, it is possible to conclude that the hypothesis I formed in my plan was correct. That is, as the concentration increased, so the rate of reaction increased.
This happened since the enzymes were able to digest protein found in a different part of the surface area of the substrate. At higher concentrations, the rate increased more slowly. This is due to the fact that as the concentration increases, the substrate is covered in enzymes, and there is no more surface area to be covered. This can be seen more easily in diagrammatic form:
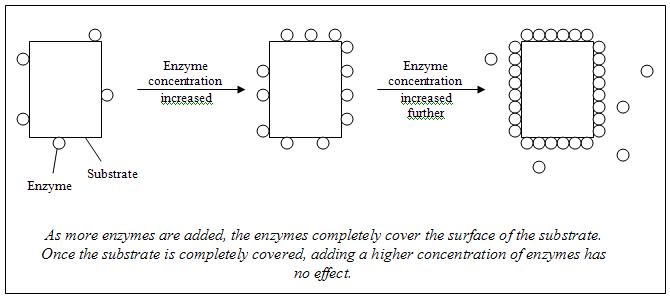
At first, the rate of reaction increased steeply as doubling the concentration doubled the number of enzymes acting upon the surface of the substrate. After about 0.5% concentration, however, the rate did not increase as quickly, as the surface of the substrate began to get almost completely covered with enzymes. If the concentration was further increased to a level above that investigated here, then there would eventually be no increase in rate, as the substrate surface would be completely saturated with enzymes.
Evaluation
This experiment was successful in that it proved my original hypothesis.
I think that the number of repeat results taken shows that the data obtained was reliable, since three repeat experiments is enough to prove the basic idea behind a hypothesis. However, three is a relatively low number of experiments, and so I do not think that numerical conclusions can be calculated from the data – for example, it would be unwise to base a formula to find the rate of reaction given a particular concentration on a data set of this size.
One particular weakness of this method of conducting the investigation is that the end point is difficult to determine and open to personal opinion. A better method of conducting the experiment would be use a variable that could be scientifically measured.
Another problem is that the pig pancreatin used is impure, and contains many kinds of protease enzymes, as well as other enzymes. In order to investigate the effect of the protease enzymes in pancreatin more closely, then the protease enzymes should be extracted. For a very thorough investigation, the different types of pancreatin enzymes themselves could even be separated out, as concentration may have a slightly different effect on each one.
Overall, however, the experiment was successful enough to fulfil the aim, since the effect of enzyme concentration of the hydrolysis of gelatin by protease enzymes has been investigated, and reliable conclusions have been drawn. Other investigations could be planned in future to extend the investigation, including looking at the effect of concentration on individual types of protease enzyme. Therefore, the experiment was appropriate to its purpose and successful.